As a trader, recognizing a trend early is one of the most important tasks. The sooner we recognize a trend, the sooner we can jump on the bandwagon and the longer we can take advantage of the trend.
Ahead of a trend
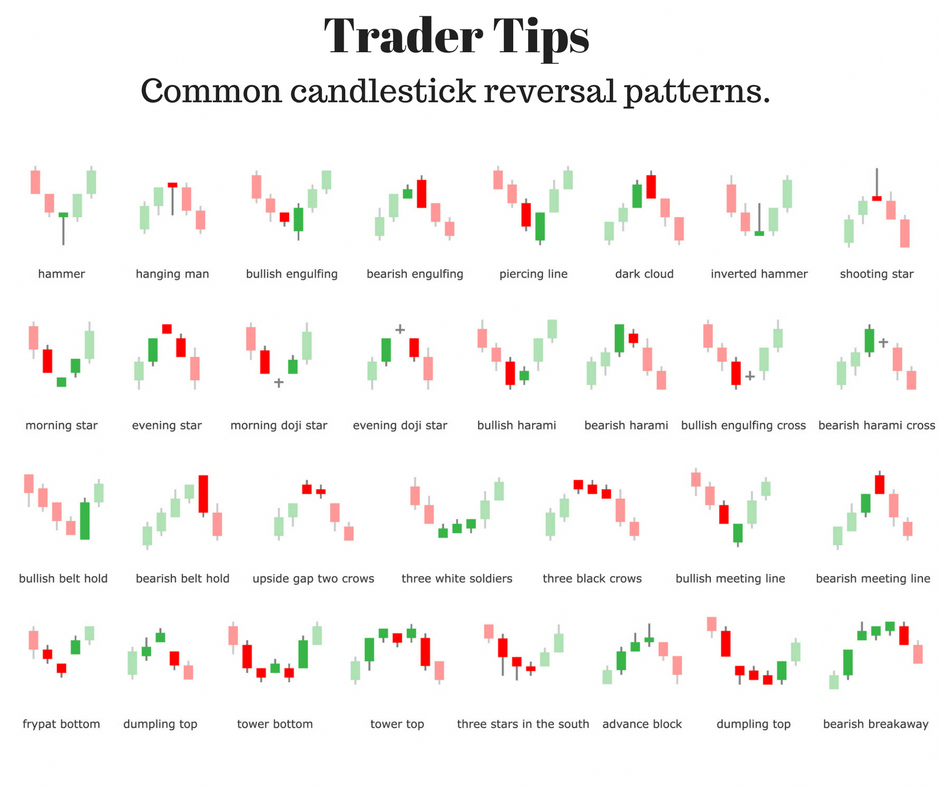
For a pattern to be called a reverse pattern, it needs a trend before that can be reversed. Before a reversal to an upward trend (Bull trend), is therefore a downward trend (Bear trend) necessary. To recognize a trend, the use of trend lines helps, moving means but also other methods of technical analysis.
Hammer and hanging man (Hanging Man)
The Hammer and Hanging Man (Hanging Man) look exactly the same, but have a completely different meaning, depending on the previous price movements. Both have small bodies, long upper shadows and short or none at all below.
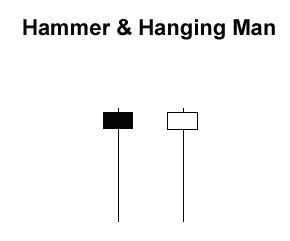
The hammer is a pattern to a bull trend (Upward trend), it follows a bear trend. When the price falls, hammers signal that the bottom has been reached and the price will start to rise again. The long lower shadow shows that sellers are pushing the price down, but the buyers are getting stronger, so that the closing price is close to the opening price.

Wisdom:
Just because a hammer is created during a downtrend, this does not automatically mean that you should place a buy order. The uptrend should also be reflected in the next candle before you place the buy order. A long white body appears next, this is a good time to close the sell order from before the hammer.
Criteria:
- The long shadow is about two to three times the size of the body
- A small or no upper shadow
- The body is at the top of the candel
- The color of the body is not decisive
The hanging man is a pattern that represents a trend reversal to a bear trend (Downtrend) Announces, but can also signal an upper or strong resistance level. When the price rises, the Hanging Man tells us that the sellers were stronger than the buyers for a short time. The long shadow below shows that sellers have pushed the price down, however, the buyers were able to raise the price again, but only close to the opening price. This should attract our attention, as it tells us that there are too few buyers to drive the uptrend.
Criteria:
- A lower shadow that is about two to three times longer than the body
- No or very small upper shadow
- The body is located at the top of the candle
- The color of the body is of little importance, although a black body is more bearish (Signaling a downward trend) is considered a white body
Inverted Hammer and Shooting Star
The inverted hammer and the shooting star look identical. Depending on whether you are in an uptrend or downtrend, the statement is different. Both have a small body, a long upper shadow and a short or no lower shadow.
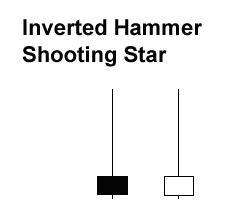
The inverted hammer then occurs, when the price falls and then a possible reversal point is imminent. Its large upper shadow shows that buyers have been trying to increase the price. Sellers saw what was happening, tried to counteract this and brought the price down again, but not further than close to the opening price. Because the sellers weren't able to, lower the price more clearly, this is a sign, that everyone who wanted to sell has already done so. When there are no sellers left, Who's Going to Be? Exactly, the buyers.
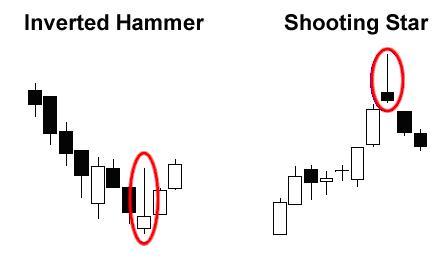
The Shooting Star is the pattern that follows an uptrend, can mark the reversal point to a downtrend. Its shape shows that the opening price is close to the lowest price, but then climbed back to the starting point. This means that buyers tried to push the price up, but the sellers came and grew stronger. A bearish sign (Indicator of a downtrend), because there are no more buyers.
Summary of Candlesticks
Candlesticks arise from the opening, Maximum, Low- and final price.
- If the closing price is above the opening price, this results in a hollow (white or. green) Body
- If the closing price is below the opening price, a full (black or. red) Body
- The thick middle part of a candlestick, we call the body
- The thin lines above or below the body show the range between the highest and lowest price and are called shadows
- The highest point of the upper shadow, shows us the highest price
- The lowest point of the lower shadow, shows us the lowest price
- Long bodies tell us that a lot has been bought or. was sold. The longer the body, the more intense the purchase- or sales activities
- Short bodies reveal that little was traded
- In FOREX language, buyers are the bulls and sellers are the bears
- Candlesticks with long shadows at the top and bottom but a very small body are called spinning tops. This pattern shows us an indecision between bulls and bears
- Marubozu means that there are no shadows. Depending on whether the body is full or hollow, is the highest and lowest price equal to the opening- or final price.
- Doji have the same opening- and final price or the difference is very small
- The hammer indicates an upward trend, it occurs during a downtrend
- The hanging man indicates a downward trend, it comes during an uptrend
- The inverted hammer occurs when prices fall, when a trend reversal is on the horizon
- A shooting star is a possible sign, that an upward- reverses into a downtrend

