A Moving Average, on German moving average, is a method of smoothing price movements in a certain period of time. The Moving Average calculates an average of the last closing prices of a certain number of trading sections.
Like any other indicator, we also use the moving average to help anticipate future price movements. If you look at the slope of the mean, then they can take a picture of it, where the price will continue to move.
As I said before,, the mean smooths price movements. There are different types of moving averages, and each species has its own degree of smoothing. Basically, we can say, the smoother the price movements, the slower the reaction to a price movement. Inverse, the lower the smoothing, the faster the reaction to a price movement.
Simple Moving Average (SMA)
A Simple Moving Average, In short, SMA is the simplest type of moving average. This is simply calculated by adding up the last X closing prices and then dividing them by X.
As an example for a better understanding. You have a diagram with 5 different closing prices on your screen. For a Simple Moving Average, add the five final prices, then divide the result by five. How to get the average of the past five trading periods.
Depending on the time span and number of trading periods, this calculation becomes correspondingly longer and more complex. You can save yourself this arithmetic work, because your MetaTrader user interface has a function, that does it for you. However, you should understand how the different types of averages are calculated, to then decide which average is the most suitable for you.
As with any other indicator, a moving average works with a delay. This is due to, because you are looking at the averages of the imposed trading segments. That's why you don't get a concrete forecast, but only a forecast of the price development.
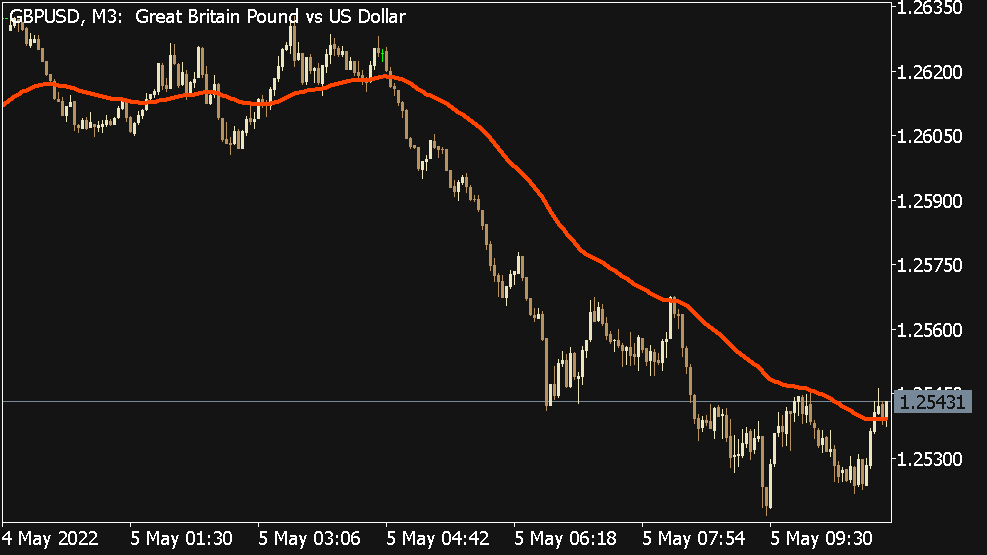
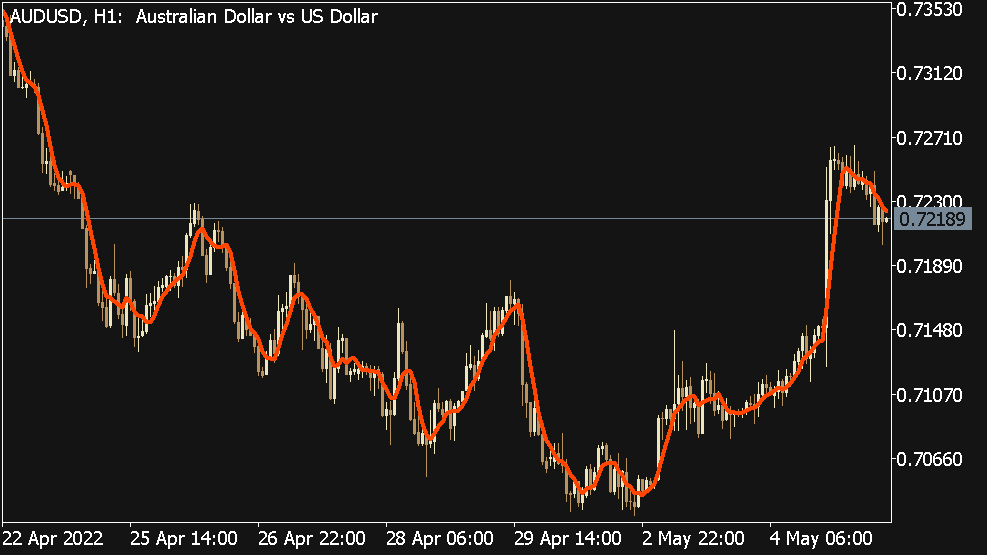
SMA about 5 Trading Periods
SMA about 55 Trading Periods
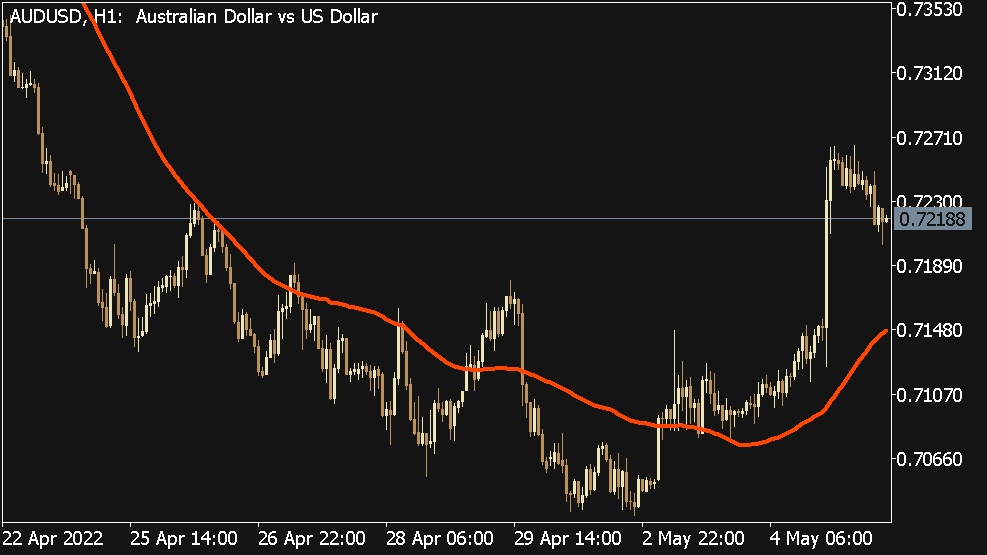
On these charts, you can see how an SMA smooths out price movements. In the first chart, the simple mean of the last 5 Trading Periods Used, in the second chart we have the number of last 55 Calculate periods. It is easy to see, the higher the number of periods, the slower the reaction to a price movement.
The SMA's in these charts give you an assessment of the market at the given time. Instead of just looking at the current price, the simple mean gives us a comprehensive view of the market, and we can use it to make a basic forecast for future price movements.
Exponential Moving Average
Although the Simple Moving Average is a great tool, after all, this method also has a decisive disadvantage. SMA's are very susceptible to spikes.
Example:
We have SMA Chart, with the closing prices of the last 5 Days (trading period are 24 Hours) on our screen:
Day 1: 1,2345
Day 2: 1,2350
Day 3: 1,2360
Day 4: 1,2365
Day 5: 1,2370
The Simple Moving Average (SMA) would be calculated like this:
(1,2345 + 1,2350 + 1,2360 + 1,2365 + 1,2379) / 5 = 1,2358
What happens if the price is at 1,2300 lies? The result of the simple mean would be significantly lower, so according to the SMA, the price would fall, when in reality it is rising. Day 2 was sometimes only a one-off event (e.B. Consequence of interest rate cuts).
To put it in a nutshell, sometimes a Simple Moving Average may be too easy.
But we have another tool at our disposal, namely the Exponential Moving Average.
Exponential Moving Averages (EMA) put more emphasis on the last periods. In our example, the days 3 until 5 should be more strongly included in the calculation, which means that the peak in day 2 would not be so important. The EMA therefore provides more insight into what traders are doing at the moment.
When trading, it is much more important to know what traders are doing, than what they did at some point in the past.
SMA and EMA in Comparison
Which form of moving average is better?
Let's start with the Exponential Moving Average. If you want an average that takes more account of the last trading periods, then an EMA with a small number of periods is to be used. This makes it possible to identify trends at a very early stage, this results in higher profits. The fact is, the earlier you recognize a trend, the longer you can use it, so the longer the cash register rings.
The flip side of an EMA is, that it can trick you too. The exponential mean thus reacts accurately to a price change, that they mistakenly think that a trend is developing, when in reality the cause is only a short-term price spike.
In the case of the Simple Moving Average, the situation is exactly the opposite. If you need an average with an even gradient, that reacts with a delay to price movements, then you should use an SMA with a high number of calculation periods.
Because an SMA is slow to react to price movements, it can save you from, to follow the wrong tracks. The disadvantage, however, is that, that the resulting delay is too long and therefore you may miss a good trade.
So which method is better now?
Now, it's up to you to decide. Many traders overlay multiple moving averages on their chart, so you can get the benefits of both. You can, for example,. Display an SMA with many calculation periods to get an overview of the general market situation and then an EMA to identify a good time, to open a trade.
In fact, many systems are based on moving average crossovers, i.e. the use of different moving averages.
Just try to overlay different moving averages on a chart and interpret what you can see from them. You may also use different chart patterns, to see how the price movements affect the mean.
Summary
- A moving average is a method of smoothing out price movements.
- There are many types of moving averages. The most popular two are: Simple Moving Average and Exponential Moving Average.
- Simple Moving Average (SMA) is the simplest type of moving average, However, they are susceptible to spikes.
- Exponential Moving Average (EMA) are increasingly based on the latest prices and therefore show us what traders are doing at the moment.
- It is much more important to know what traders are doing, than to learn what they have done in the past.
- SMA's show smoother curves than EMA's.
- A longer calculation period gives a smoother curve than if you only consider a few trade segments.
- EMAs react quickly to price movements and trends can be detected early. But be careful! EMAs can also mislead us at peaks.
- SMA's react more slowly to price movements, but protect you from wrong decisions by spikes. Due to the delayed response, you may miss out on a good trading opportunity.
- The best method is to add multiple moving averages to your charts. This gives you a long-term overview and a statement about current price movements.


")


