In the previous chapter, we briefly addressed the topic of candlesticks, now we will take a closer look at what candlesticks are and how you can use them for your activity as a FOREX trader. Candlesticks are originally from Japan, Steve Nison then discovered this technique for use in trade statistics.. Now let's take a look, what candlesticks are, what they tell us and what they are made of.
Candlestick Charts
Candlestick charts contain the same information as bar charts only in a graphically more beautiful format.
Again, the vertical line shows the range between the highest and lowest price in the corresponding period. Candlesticks but have a large middle part, this shows the opening- and the final price. Usually the middle part is filled or colored if the price is lower at the end than at the opening.
Candlestick charts have exactly only the purpose to provide a visual aid, because otherwise you contain the same information as bar charts. Advantages are:
- Candlestick charts are easier to interpret and especially for beginners it is easier to analyze such charts
- Candlesticks are easy to use. Your eye will quickly adapt to recognizing the information it contains
- Candlestick patterns have names like Shooting Star, that help you what these patterns mean
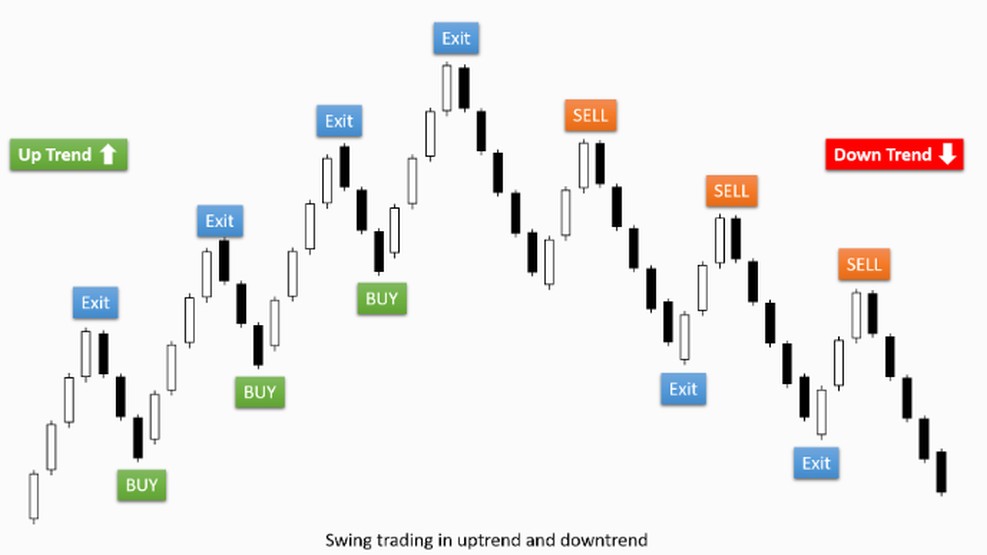
- Candlesticks make it easy to recognize reversal points, i.e. the point in time when an upward trend turns into a downward trend, or vice versa
Furthermore, we will work here mainly with Chandlesticks.
What candlesticks tell us?
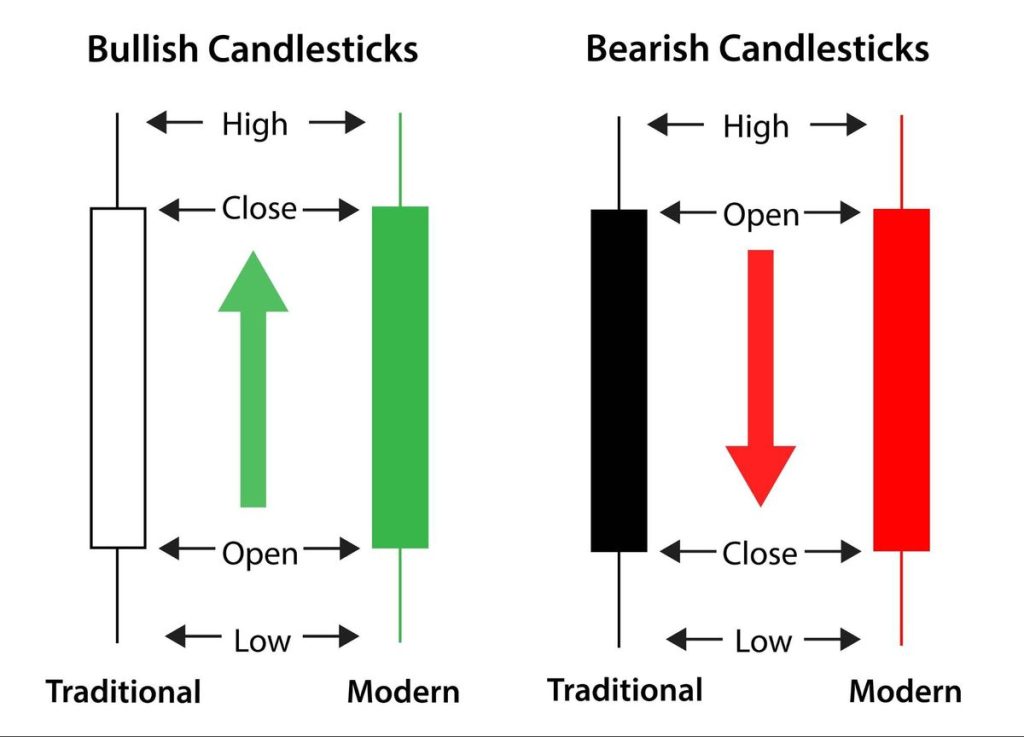
Candlesticks inform us about the opening, the maximum, the lowest- and the final price.
- If the closing price is higher than the opening price, a hollow middle part appears
- Is the closing price lower than the opening price, we get a full middle part
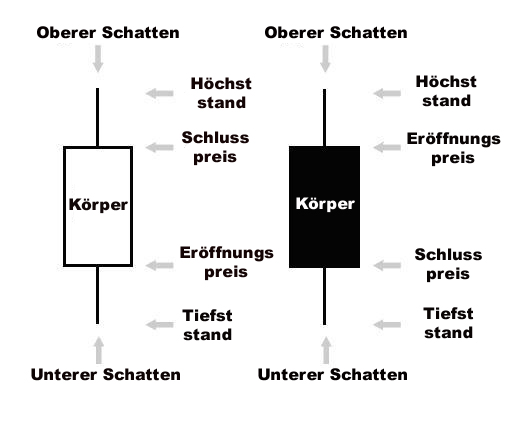
- The thin lines above and below the body, show the range between maximum- and lowest price and are referred to as shadows
- The upper end of the upper shadow shows the maximum price
- At the very bottom of the lower shade is the lowest price
Meaning of the different bodies and shadows
The bodies and shadows of candlesticks can take on a variety of patterns. Long body and short shadow, long shadow and short body or the whole vice versa and then in different colors? For us, the question now arises, what these patterns tell us.
The bodies
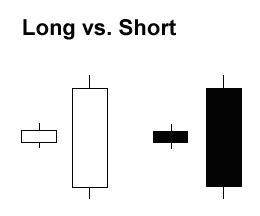
Like us humans, candlesticks also have different body measurements. When it comes to FOREX, there is nothing more interesting than measuring the bodies. Long bodies show that a lot is bought or sold. The longer the body, the higher the afterfage.
Short bodies indicate low trading activity.
For the FOREX dictionary:
Bull or bull are buyers and bears so bears are the sellers.
Long white candlesticks are a sign of strong buying activity. The longer a white body, the higher the conclusion- above the opening prize. This shows a significant price increase, so the bulls are in top form (there is a lot of buying).
Long, full body, show strong sales, on the other hand. The longer a full body, the further the closing price is below the opening price. The price drops sharply, the sellers (Bears) are diligently at work.
The Shadows
The shadows above and below the body provide important clues about the course of the trading period. The upper shadow shows the maximum price, while the lower shadow provides information about the lowest price.
Long shadows mean that the price changes during the trading period, significantly above or. under the opening- and final price. Short shadows show that the price is close to the opening- or final price has moved.
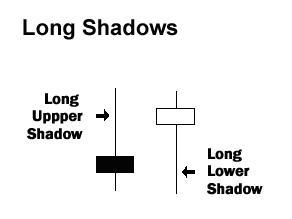
When a candlestick has a long upper and short lower shadow, this means, that the buyers were active and increased the price. For whatever reason, but then the sellers came into action and brought the price back close to the opening price.